
Hot Keywords:Land diesel engineDiesel engineWeibaoping PowerR series diesel engineHT series diesel engineFixed power diesel engineR4105R6105R6113HT6126HT61856kw-330kw diesel engineDiesel engine for generatorConstruction machinery engineAgricultural machinery engineVehicle diesel engineGenerator powerDirect injection diesel engineLow fuel consumption engineWater cooled diesel engineElectric start diesel engineHigh power diesel engineDurable engine
Imports of diesel engines reached 1.800 billion US dollars, a year-on-year increase of 17.55%. (Among them: marine diesel engines and vehicle diesel engines with P≥132.39kw saw a year-on-year increase of over 22%; all other diesel engines declined year-on-year)
Imports of gasoline engines stood at 346.85 million US dollars, a year-on-year decrease of 31.34%. (Gasoline engines with a displacement of 50ml < V ≤ 3000ml declined by less than 30%; those with other displacements dropped by over 70%)
Imports of other complete ICE units were 2.37475 billion US dollars, a year-on-year increase of 9.71%. (All subcategories saw growth except biogas engines; marine other spark-ignition reciprocating or rotary piston ICEs, other unspecified spark-ignition piston ICEs, and other compression-ignition piston ICEs with an output power of ≤14kw registered a year-on-year increase of over 25%)
Imports of ICE parts and components reached 4.98419 billion US dollars, a year-on-year decrease of 2.47%. (Catalytic converters or particulate filters for purifying or filtering exhaust gases from ICEs (whether combined or not) and crankshafts for marine diesel engines saw a year-on-year increase of over 25%; electronic control fuel injection devices and coolant pumps for piston ICEs dropped by over 20% year-on-year)
Imports of generator sets were 903.85 million US dollars, a year-on-year increase of 10.14%. (Compression-ignition ICE generator sets with P≤75KVA and 375KVA < P ≤2MVA grew by over 30% year-on-year; all others declined year-on-year)
Exports of diesel engines reached 1.32845 billion US dollars, a year-on-year decrease of 0.93%. (Marine diesel engines rose by 20.84% year-on-year; vehicle diesel engines with P≥132.39kw increased by 5.12% year-on-year; all other diesel engines declined year-on-year)
Exports of gasoline engines stood at 2.07389 billion US dollars, a year-on-year decrease of 1.57%. (Gasoline engines with a displacement of 50ml < V ≤250ml grew by 23.86% year-on-year; reciprocating piston engines for vehicles with a displacement of >3000ml increased by 17.30% year-on-year; those with other displacements declined year-on-year)
Exports of other complete ICE units were 3.44208 billion US dollars, a year-on-year increase of 28.50%. (All subcategories saw growth except biogas engines; marine other spark-ignition reciprocating or rotary piston ICEs surged by 149.35% year-on-year; other compression-ignition piston ICEs with an output power of ≥14kw registered a year-on-year increase of over 32%)
Exports of ICE parts and components reached 14.76737 billion US dollars, a year-on-year increase of 5.00%. (Parts for locomotive diesel engines, parts for diesel engines with P≥132.39kw (180hp), and engine superchargers (excluding turbochargers) grew by over 10% year-on-year; crankshafts for marine diesel engines and electronic control fuel injection devices increased by nearly 30% year-on-year)
Exports of generator sets were 6.72022 billion US dollars, a year-on-year increase of 23.91%. (All subcategories achieved growth; compression-ignition ICE generator sets, especially those with P>75KVA, saw a year-on-year increase of over 24%)
| Category | Product Name | Quantity - YoY Growth (%) | Value (10,000 US dollars) - YoY Growth (%) |
| Imports & Exports | Total | - | 38,741.83 / +8.38 |
| I. Imports | Subtotal | - | 10,409.82 / +2.74 |
| Among which | |||
| (I) Total ICEs | - | -0.76 | 4,521.78 / +7.63 |
| 1. Diesel Engines | - | 4.14 | 1,800.18 / +17.55 |
| 2. Gasoline Engines | - | -41.51 | 346.85 / -31.34 |
| 3. Others | - | 12.07 | 2,374.75 / +9.71 |
| (II) Total ICE Parts & Components | - | - | 4,984.19 / -2.47 |
| (III) Generator Sets | - | -60.23 | 903.85 / +10.14 |
| II. Exports | Subtotal | - | 28,332.01 / +10.61 |
| Among which | |||
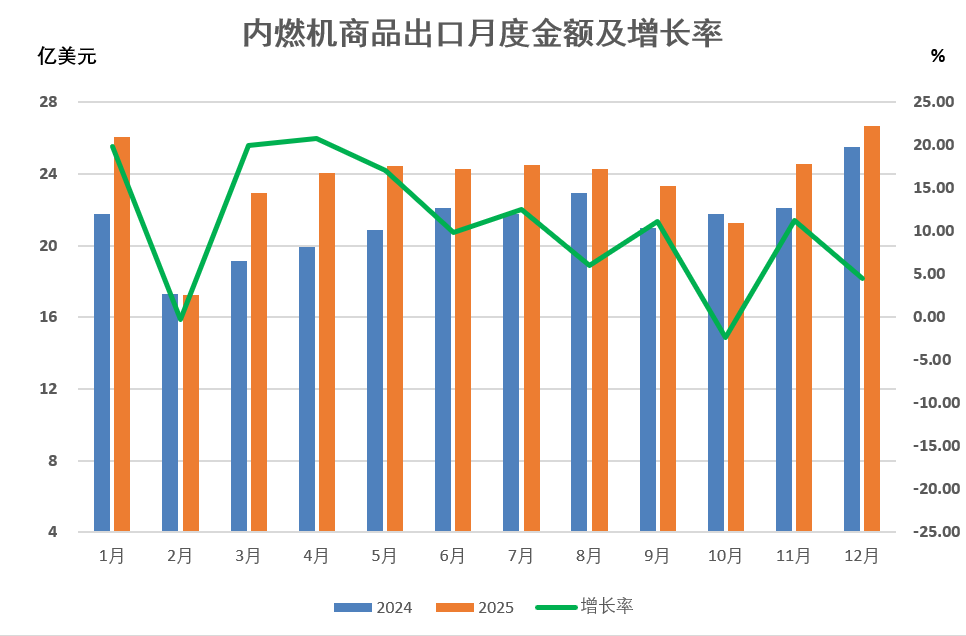
| (I) Total ICEs | - | 20.37 | 6,844.42 / +11.72 |
| 1. Diesel Engines | - | 71.55 | 1,328.45 / -0.93 |
| 2. Gasoline Engines | - | 16.16 | 2,073.89 / -1.57 |
| 3. Others | - | 18.93 | 3,442.08 / +28.50 |
| (II) Total ICE Parts & Components | - | - | 14,767.37 / +5.00 |
| (III) Generator Sets | - | 10.17 | 6,720.22 / +23.91 |
Do you need any help?
+86-13053677188
Follow Us
Copyright © 2026 baopingpower.com All rights reserved.
Weifang Baoping Power Co., Ltd.

+86-13053677188
+86-13053677188
info@baopinggroup.com
 English
 Chinese
 French
 German
 Russian
 Italy
Italy Spain
Spain Portugal
 Japanese
 Korean
 Arabic
 Traditional